|
Stereo 3D XYZ-Axes Graph Plotting Viewer R.P. Hart – June 9, 2018 |
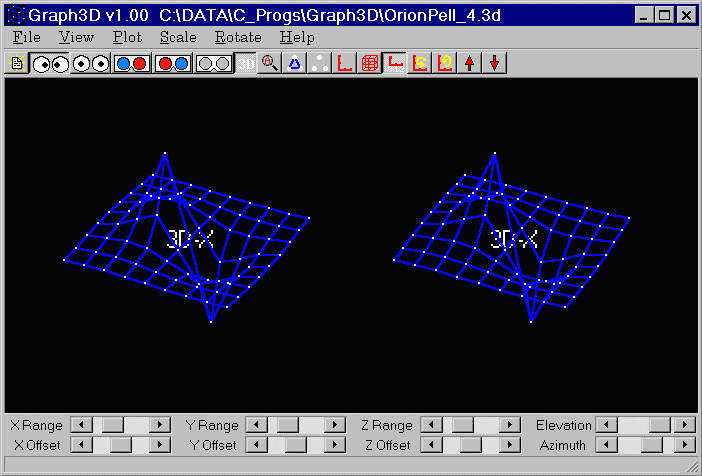
This freeware program is a stereo 3D graph data plotting
viewer used to display an input text file xyz-axes data set on a 3 dimensional
grid with an additional 4th dimension implemented as plotted dot size. The
graph grid display is implemented in 5 modes: Side by side
"cross-eyes" & "wall-eyes" 3D stereo;
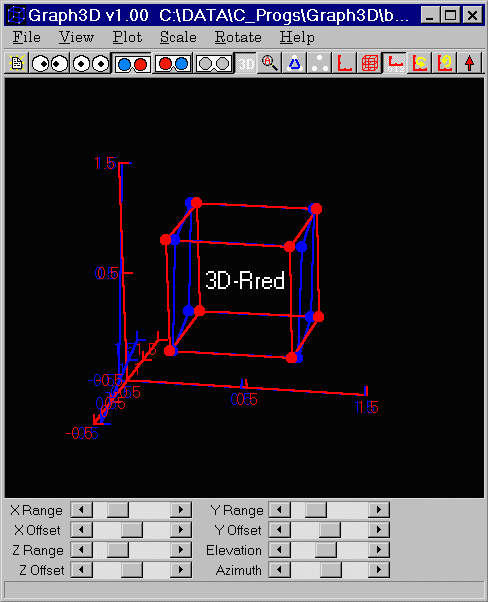
Superimposed red-right/blue-left & red-left/blue-right filter glasses 3D
stereo; Single grid mono "perspective view" 3D. The 3rd
and 4th dimension text file data columns are optional.
You have control over scale ranges and offsets, azimuth (rotate about center of vertical y-axis) and elevation (rotate about center of horizontal x-axis) both manually and automatically, and z-axis polarity. You can do typical Windows things with the graph like copy to clipboard for pasting to other applications, save to disk file, and print.
While working on multi-parameter non-linear model data fitting, I developed this software to gain insight into non-linear optimization solution multi-spaces with RMS error plotted as (inverse) dot size in three dimensions. The smaller the RMS error--the better the solution--the larger the dot size, with the best solution plotted as the single largest dot.
The program can also be used to plot shapes for stereo 3D viewing fun. You can suspend a shape in 3D space and make it tumble while controlling object size, tumble speed, depth location. This is a Windows program written in Borland C++Builder 5.0 with all needed libraries linked within a single executable (no dll's needed).
The old DOS 16-bit VGA version of the program is no longer on the website. If you want the older version, Email me.
|
Contents |
||||||||||||||||||
|
|
|
Stereo 3D Graph Demonstration
The following sequence of graphic images demonstrates the
use of my stereo 3D Graphical Viewer. To fully appreciate the images, you
must both master the "cross-eyes" viewing technique and procure or
make red/blue filter viewing glasses.
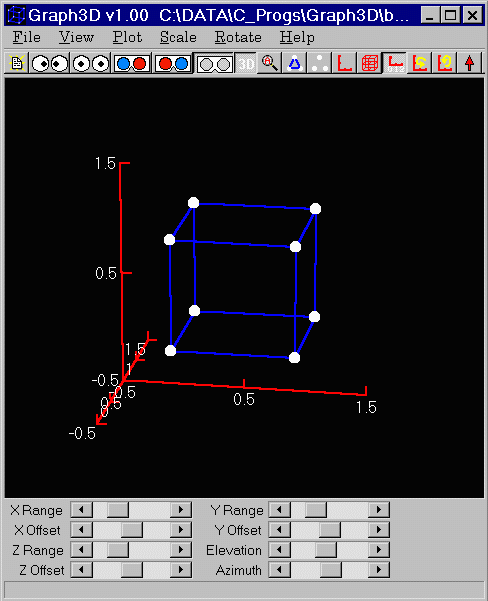
Standard
"Perspective View" 2-D Graph
Blue/Red
"Filter Glasses" 3D Graph 
"Cross-Your-Eyes"
Technique 3D Graph 

More
Serious Use of 3D Graph 
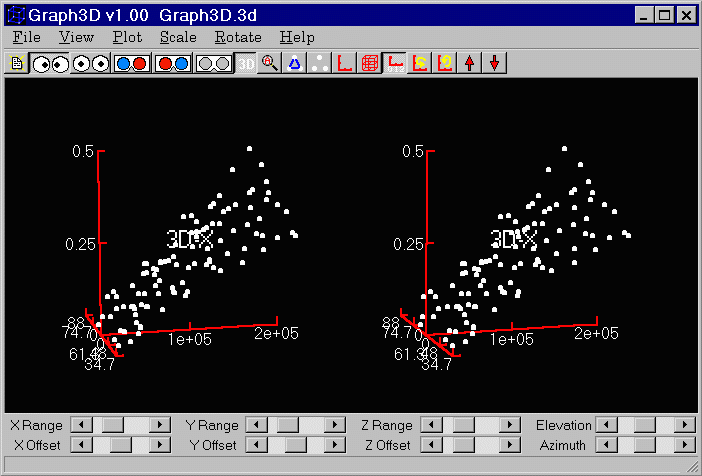
"Wall-Eyes"
Technique 3D Graph 
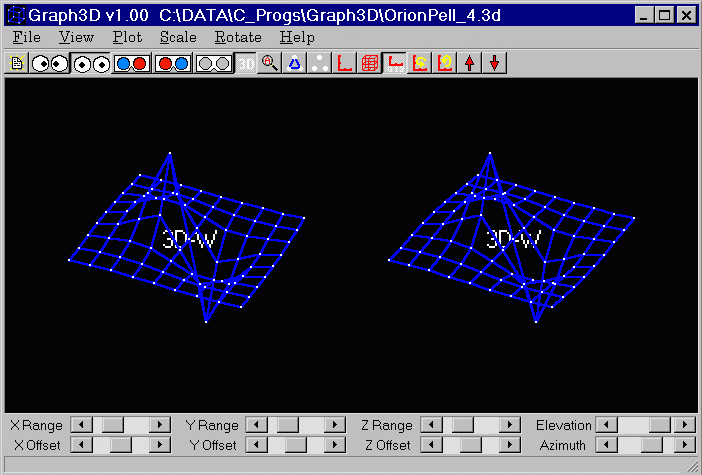
"Cross-Your-Eyes"
Technique 3D Graph 
Download
Program
Graph3D.zip v2.1.3 (350K) June 9, 2018
Revisions
List
v1.002
- October 1, 1999
Initial Release
v1.003
- October 20, 1999
Fixed problem with Table3d format data files: Table
row lengths were limited to only 50 characters. Changed from 50 to 5000.
v1.112
- November 27, 1999
Added 'Setup File Input' window to setup: 1) x-axis, y-axis,
z-axis and dot size assignments to file record field numbers (up to 20 fields
in file record); 2) Random sub-sampling of file records (plotted points) for
large files. Included File menu items and speed buttons to control this
window and re-opening of files for successive random samples. Also fixed
minor problem when trying to open non-existent file (such as on default
startup), handles error condition more gracefully. Fixed another startup
bug related to missing (cold start) Registry key (thank you, Mauro).
v1.120
- December 4, 1999
Fixed offset scaling problem. If original data range
was above zero, didn't properly adjust offset up near the bottom of the range,
just left it at zero which placed data range too high relative to grid.
Also added proper indicator of # of points plotted for Table3D format.
v2.00
- March 12, 2000
Added features: Graph & axes titles (thank you for
the suggestion, Brent); Print the graph (thank you for the suggestion, Tom D.);
Copy graph to clipboard for pasting into other Windows applications; Save the
graph as a *.bmp bitmap to a file; Set the various colors individually:
background, grid, text, points, lines; Right mouse button pop-up menu for
quick access to common menu functions (those which are not part of the speed
buttons).
Fixed various buttons Registry save/restore problems.
v2.0.2 - March 24, 2001
Added features: Scale->Invert
Z-Axis menu item and corresponding speed button to control z-axis
polarity. Note that the 'normal' polarity has been changed to conform to
vector convention with + toward the viewer (thank you Bart-Jan for pointing
this out to me).; Elevation and Azimuth angle indicators adjacent to the
corresponding slider control bars (you finally got this for free, Simon F.).
Fixed problem with last opened files which appear at the bottom of the 'File'
menu where blank entries would appear where filenames should be.
v2.1.1 – April 11, 2018
Added features: Various ‘Hint’ additions to
make keyboard shortcuts visible when mouse pointering over controls &
buttons.
Saverd/retrieved XYZ range and offset settings
to/from Registry to keep same manually sized and positioned view after
reloading same file (for iterative *.3D data file additions/improvements to
avoid having to resize/position for same view.
Modified F7, <Shift>F7, F8, <Shift>F8
keyboard shortcuts to use for adjusting elevation and azimuth, respectively.
V2.1.2
– April 12, 2018
Added “Fade” button and feature to fade lines
toward back of view so that busy plots show forward areas more prominently.
V2.1.3
– June 9, 2018
Reduce Auto-Rotate step angle from 3 to 1 degree
for smoother rotation. Add a few faster
auto-rotate rates.
3D_Graph.exe
Instructions
Real Stereo 3D Viewing
This program is a 32-bit Windows (W95/98/NT/2000)
executable. It displays a 3-dimensional graph plus 4th dimension dot size
in five modes:
 Side-by-side
"cross your eyes" real stereo 3D (best depth perception -
fabulous)
 Side-by-side
"wall eyes" real stereo 3D (best depth perception - fabulous)
 Superimposed
Blue/Red "filter glasses" real stereo 3D (good depth
perception)
 Superimposed
Red/Blue "filter glasses" real stereo 3D (good depth
perception)
Superimposed
Red/Blue "filter glasses" real stereo 3D (good depth
perception)- Single graph
"perspective" effect 3D (adequate, simulated depth perception)
In all cases, the 3D effect is enhanced by the ability to rotate the graph in
two ways, elevation and azimuth, using manual slider bars or arrow keys or
using automatic animation modes.
Fun & Functional
This program is both fun and functional. You can
create nice shapes with connecting lines which can be made to tumble in 3D
space complete with ability to make the object move toward you and away from
you (using z-scale offset control or x- or y- offsets as well). A few
shape files are included with the program. But the main purpose of the
program is for serious analytical work to reveal subtle interacting effects in
multi-parameter spaces often encountered in, say, modeling and optimization
work.
Others have used it for modeling of molecules
including protein folding, immunohistofluorescence, cancer cell biology,
topographical mapping, electrical signals in the brain, theoretical physics
involving complex numbers, GPS data visualization, solid geometry, anatomical
motion studies, crystals, ultrasonic imaging, class demonstrations to interest
young students in mathematics, multi-variable calculus, isothermal surfaces,
visualizing higher order mathematical functions, U.S. early warning system
satellite data, algebraic factoring techniques, nilpotent matrices and
determinants (what's that?), showing kids vectors, lines and planes in 3D-space
(in class).
2-D Graphing Also
You will find that this program is even worthwhile to use
when you have only 2 dimensional data. The ability to show the graph in
perspective and rotation capability give more interest to such graphs.
How it Works
The program reads a text file containing 2, 3, or 4 columns
of numbers separated by delimiters (space, comma, tab, or any combination). It
handles essentially an unlimited number of lines or records of data when using
sub-sampling. Each record is treated as a plotted point on a
3-dimensional grid. The order of dimensions is: x-horizontal,
y-vertical, z-depth, dot size. The 4th column, dot size, essentially adds
a "4th" dimension to the plot but with limited resolution since only
7 sizes are used.
All 4 columns are auto-scaled upon startup so that all n record points fit within the graph limits. The xyz axes are set to 1, 2, 5 ranges with a limited dynamic range of from 0.001 through 100,000,000 (e.g. 0.001, 0.002, 0.005, 0.010, etc.). If your data fall outside this range they must be normalized. In addition to auto-ranging, the program auto-offsets the scales. Both range and offset can then be manually adjusted using slider bar controls or keyboard.
The 4th dimension, dot size, autoscales to fit the
data range into 6 dot size intervals, each of equal span. It finds the
max and min of the 4th column and sets the largest dot size to the minimum
value record. It divides the min to max range into 6 equal span regions
and assigns each record to a dot size based on where the 4th column value falls
with the regions, with the highest values assigned to the smallest dot size
(1-pixel).
Use of Dot Size for RMS
Display
The purpose of the dot-size method is to show RMS error patterns
generally for non-linear optimization problems. A typical use is in grid
search methods where you would like to see what the minima regions look like
(how steep, shallow, etc.). This is why the smallest (most negative)
value is assigned to the largest dot size (best or lowest RMS solution).
There will only be one dot of the largest size representing the
"best" solution. Only if more than one exact min exists, will
there be more than one of the largest size dots.
Getting Started: Help
Information
This newer Windows version has no help facility, however the
flyover hints and intuitive window layout, labels, and menu structure should
suffice. Keyboard control is still implemented with the same key
assignments as the old DOS version.
Here is the old DOS version help screen for reference:
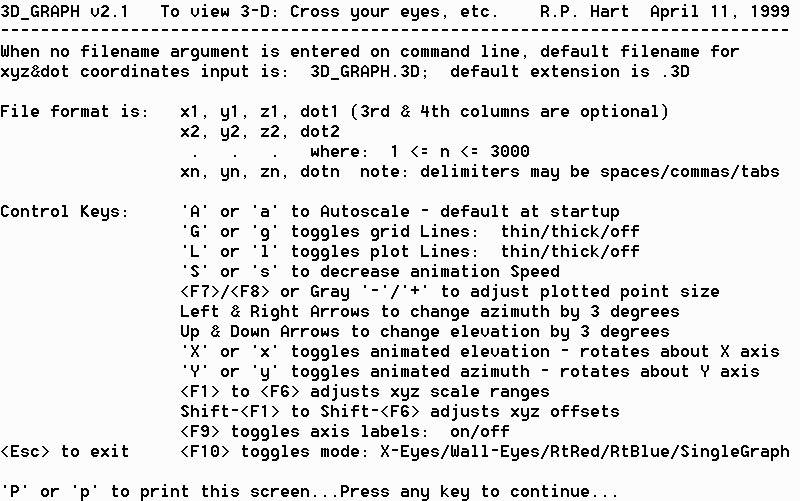
Note that plotted point size control using
<F7>/<F8> or Gray -/+ only works for less than 4 data
columns. Presence of the 4th column causes automatic dot size control
based on the 4th column values.
Data Files
Create a data file with 2, 3, or 4 columns of data.
Values may be integer or floating point format. Each row or record is a
plotted dot. When connecting lines are enabled, they are drawn between
records in adjacent rows. You can include line breaks by inserting blank
lines between sections of your graph that you don't want connected when
connecting lines are enabled.
Here is an example of a 3-column file (contents of box.3d):
0, 0, 0 Draws 2 faces of a box
plus 1 of 4 connecting lines between the faces.
1, 0, 0
1, 1, 0
0, 1, 0
0, 0, 0
0, 0, 1
1, 0, 1
1, 1, 1
0, 1, 1
0, 0, 1
0, 1, 0 Draws the 2nd of 4
connecting lines.
0, 1, 1
1, 1, 0 Draws the 3rd of 4
connecting lines.
1, 1, 1
1, 0, 0 Draws the 4th of 4
connecting lines.
1, 0, 1
With the line break feature, you no longer need to retrace over previous lines to fully draw connected line shapes as was required in the older version.
A table format is available for x, y, z graphs only. It requires a 'keyword' in the first column of the first row: 'Table3D' (without the single quotes). Use the first row as z values, the first column as x values and place the y values in the body of the table. Here's an example of a table data file: TableTest.3d
Data files may include additional record fields (columns) which are ignored by Grahp3D. This is useful when sharing files between multiple applications, each of which may require different sets of fields. Use the 'File' menu 'Setup' selection to open the 'Setup File Input' window. You may then open a new data file from this window. An example record (the first record in your file) is displayed along with x, y, z, and dot size assignments. The assignments can be changed to plot only those fields of interest while ignoring all others.
This window also provides capability to enable
[pseudo] random sub-sampling of records from your file. This is useful
for very large files where a small sampling of the plotted points provides
essentially the same basic picture of the entire set. The sampling
percentage may be set along with ability to randomize or fix the randomizer
'seed'. If you need to always select the same sub-set sequence of records
each time you open a file, use the fixed seed capability. The
sub-sampling could be useful to visualize how well random subsets represent larger
populations.
Usage
Run: Graph3D box.3d (or your data file)
or
Double click Graph3D.exe (or it's desktop icon) and 'Open'
your data file from the 'File' menu.
or
Double click Graph3D.exe and select a previously opened data
file from the bottom of the 'File' menu list.
or
Drag & Drop your data file onto the window graph display
area of Graph3D.
or
"Associate" *.3D files with the Graph3D.exe
program application and just double click the data file.
or
Put a Windows shortcut icon onto your desktop for
Graph3D.exe and drag and drop your data file onto the icon.
Windows Icon
I suggest creating a Windows shortcut icon on your desktop
which invokes the program. You can then either double click the icon or
drag and drop data files onto the icon to run them.
I also suggest you "associate" the *.3d
file extension with Graph3D.exe so that you can double click on a 3D data file
and invoke the viewer directly.
Cross Your Eyes
Technique 
It is a bit of a challenge learning how to see the 3D effect
by crossing your eyes. My first exposure to this technique was in a book
on clouds (I don't remember the title, probably just "Clouds").
There was a good set of instructions and lots of example pictures to try.
Basically the difficulty is not in the eye-crossing itself, anyone can do
that. The problem is in focusing on the plane of the display screen at
the same time you are crossing your eyes.
When we view something close to us, the eyes naturally "cross" and focus close in unison (follow your finger as you move it close to your nose and you will see that your eyes become quite crossed, more than enough to view the display screen in 3D). In fact, some people are concerned that using this cross-eye technique will do damage to their eyes or eye muscles or something. The fact that you normally angle (cross) your eyes about the amount needed for Graph3D when you read a book illustrates the silliness of that concern.
But you must learn how to cross just enough to center your right eye onto the leftmost graph view and left eye onto the rightmost graph view. When you do this, the natural tendency is to focus at the point where your left and right sight lines cross which is typically 1/4 to 1/3 of the way to the screen. (This intersect distance depends upon your Graph3D application window and monitor screen sizes, the bigger the window, the farther apart the two graph views, the closer the intersect is to your face. So it's easier to learn by setting the window size smaller.) Instead of focusing at the "natural" intersect distance, you must change your focus to the screen distance. This is the main problem.
I have created a "visual learning aid" to
help in this learning process. It consists of a piece of cardboard with a
rectangular cutout open at the top and a large paper clip bent and taped to the
cardboard protruding upward vertically into the middle of the cutout.
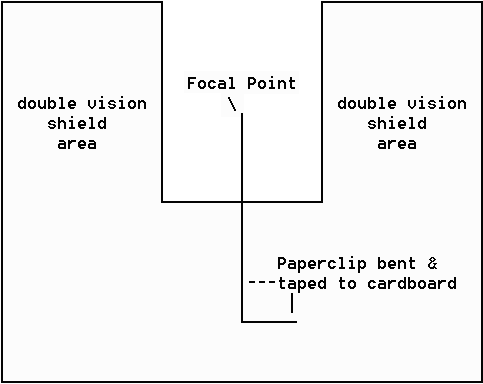
The tip of the paper clip serves as the point at which your left and right eye view lines cross. Start with the tip about half way from the screen to your face. Look at this tip (and initially focus on it as well) as you position it centered in front of the display screen. You will notice at the screen that there are two, out-of-focus graphs. Continue to focus on the tip and slowly move the tip toward your face. As you do this the two graphs in the background come together. Stop at the point where the two graphs are superimposed then quickly redirect your focus (not your eye azimuth's) to the screen.
When you are successful, you will end up with your eyes crossed through the tip of the paper clip but focused on the screen. At this point the graph will "snap" into 3 dimensions showing depth. Your brain tends to stabilize on this combination because it "makes sense". You are used to seeing things in 3D so when the graph appears in 3D, even though your focus is far for the amount of eye cross, you will tend to "hold on" to this combination to keep it in 3D.
A couple of pointers: You must keep your eyes exactly level to the screen, otherwise the two graphs will not superimpose properly. Also, the sides of the cardboard are intended to shield the "extra" views of the graph which each eye sees so that you aren't distracted by them. Realize that there are two graphs there and without the shields, each eye would see both of them. When you cross your eyes and superimpose one from each eye, that leaves one additional view extra (on opposite sides) for each eye. So it appears as three graphs, the middle one in 3D. You must be sure the opening of the cardboard is just wide enough to view one whole graph with each eye and no more. You can figure out this width by using your hands held apart at varying amounts while alternately closing one eye and then the other. Adjust the distance between them and the distance to the screen so that you can see only the full left graph with your right eye and full right graph with your left eye. Use this hand spacing distance as your cutout spacing. (You may find that at this point you can already see the 3D and don't need to make the visual aid.)
After awhile this technique becomes second nature and it's easy.
3D cross-eyes stereo help/instruction link: no
longer available
Red/Blue Filter Glasses 
If you just can't master the "cross-your-eyes"
technique. Make or buy some filter glasses and use the 3D filter glasses
mode instead. The right eye can be a red or blue filter and the left eye
blue or red, respectively, to match the graph colors on your screen. It has
been brought to my attention by a user that typically, standard red/blue
glasses use red on the left. I've added additional 3D modes to
accommodate this and also "wall-eye" viewing. Select the
appropriate viewing mode from the 5 different 3D modes under the 'View' menu or
by using the speed buttons.
I found the proper materials in the Edmund Scientific catalog. They sell some cardboard "gimmick" distorting filter glasses which you can buy and cutout the thin plastic filters from and then buy sheets of red and blue filter plastic and cut rectangles slightly larger than the openings. Tape them into the back of the cardboard frames and you're all set. I found I had to use two layers of red to get the right amount of filtering (one layer let a little blue through). Depending upon the monitor color tones, you may need to double up on the blue as well.
3D filter glasses, etc., links:
http://www.stereoscopy.com/links/index.html
http://www.3d-web.com/gallery.htm
Good
Luck!
If you find yourself marveling at how neat this graphical
viewing method is or how much it helps you to visualize non-linear optimization
solution spaces, or how it helps you in whatever is your application, please
Email me with comments or suggestions for improvements. I've had a many,
many useful comments, suggestions for improvements, and descriptions of
interesting applications which has helped me make the program significantly
better than my original concept.
Good Luck!
R.P. Hart March 24, 2001